You’re interested in playing college baseball, but what are your chances of making it to the next level? While many tout national probability as gospel, it turns out your odds of playing at the next level vary greatly depending on where you live.
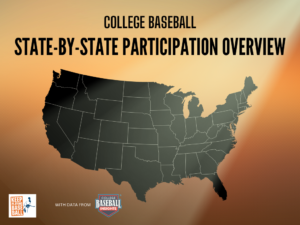
If you’re wondering what percentage of high school graduates from your state play at each college level and where they are playing, you’ve come to the right place. In this mini-series, we team up with data from our friends at College Baseball Insights to provide you with a regional and state-level overview of your chances to play at the next level. In each overview, we’ll break down:
- High school baseball participation by state
- Number of HS graduates from each state participating at each level of college baseball
- The odds of playing at each level of college baseball for high school graduates from every state
- An overview of player participation trends compared to national and regional average
Here’s more on the regional and state-by-state overviews…
Regional Breakdowns
We’ve broken the U.S. into the 7 geographical regions listed below. The regional overviews with breakdowns of every state in the region are completed and linked below. As soon as we complete a state-level overview (same state breakdown from regional overview but with graphics and additional insight), they will be linked below as well. Simply click on the hyperlinked name below to view the breakdown!
Midwest
North Dakota, South Dakota, Minnesota, Illinois, Indiana, Michigan, Ohio, Wisconsin, Iowa, Nebraska, Kansas, Missouri, Kentucky
West
California, Hawaii, Nevada, Utah
Northwest
Washington, Oregon, Idaho, Montana, Wyoming, Alaska
Southwest
Arizona, New Mexico, Colorado, Texas, Oklahoma
Southeast
Florida, Georgia, South Carolina, North Carolina, Tennessee, Mississippi, Alabama, Louisiana, Arkansas
Mid-Atlantic
DC, Virginia, West Virginia, Maryland, Delaware, New Jersey
Northeast
New York, Pennsylvania, Massachusetts, Rhode Island, Connecticut, New Hampshire, Vermont, Maine
Note: The regions were created by geographical area and are used to simplify the presentation of the data. Within each region, you will see the state numbers and probabilities, along with some qualitative analysis to help make sense of the data and recruiting trends. For more information on state level participation, check out CBI’s state participation feature HERE.
Why is This Data Important?
The recruiting process can pull players and families in many directions. The more informed you are, the better you’ll be able to spend your time and money in pursuit of a college baseball fit. We see players waste time and money on ill-informed recruiting decisions all the time. Mostly, it’s not their fault. They simply don’t know any better.
Armed with the right information and an objective view, however, it’s easier to see red flags and money traps during recruitment. With data, you can see right through marketing schemes of companies trying to make a quick buck from poorly informed recruits and families. The example below helps to illustrate how informed recruits are better off:
Data Informed Decision-Making Example
Let’s say you are a high school baseball player in Iowa with average ability. You read about a showcase camp being put on by a popular company that will have D1 coaches in attendance. All the players and parents on your team are talking about it, and no one wants to miss out on a chance to get ranked and seen by D1 coaches. It sounds like a great deal, and maybe it would be if you were a legitimate D1 prospect.
Luckily, you’ve done your homework. You read up on state participation and know that last season, there were only 13 D1 freshmen baseball players from Iowa last season, roughly 0.38% of that baseball grad class! You know you are nowhere near the top 10% of players at your position in Iowa right now, let alone the top 1%. Instead of taking the bait and spending $750 on “exposure” to D1 coaches, you decide to invest that money into training that will help you get better. You’ve not only saved $750 that would have been wasted, but you’ve used it to improve your skill set and chances of playing at the next level. All this was possible because you used the data to make an informed decision.
Our Methods
We used the most recent NFHS State Participation Data (2022) to determine the number of high school baseball participants for each state. We then used College Baseball Insights roster data to determine how many high school graduates from each state are participating at each level of college baseball. The raw data comes directly from these two sources. Estimated odds of playing at a particular level was calculated by dividing the total number of participants from that state playing at a particular collegiate level by the total number of active high school participants for that state. This number is then multiplied by 100 to get the probability or odds. We’ll also add color to the numbers using resources like College Baseball Insights State Participation Insights and the total number of college programs at each level in each state, among other resources.
Limitations
This article and other articles in this series are written with data and insights from 3rd party sources, College Baseball Insights and NFHS High School Participation Data. Data and insights are subject to revision and/or change. We’ve attempted to display as accurate a picture as possible with the information that is available. Readers should be aware that college baseball roster data is fluid and changes throughout the year. Roster data is reconciled by College Baseball Insights throughout the year, but this article may not reflect those changes. Insights cannot account for gap year programs, misreported roster information, or other inaccuracies which may slightly alter the numbers and percentages used in the articles. Insights are subject to change and are based on best available information.
