
State Participation Overview: West Region
-
by
KPB
You’re interested in playing college baseball, but what are your chances of making it to the next level? While many tout national probability as gospel, it turns out your odds of playing at the next level vary greatly depending on where you live.
If you live in the West and are wondering what percentage of high school graduates from your state play at each college level and where they are playing, you’ve come to the right place. In this article, we team up with our friends at College Baseball Insights to provide you with state-level overview of your chances to play at the next level.
For each of our Western states below, we break down:
- High school baseball participation by state
- Number of HS graduates from each state participating at each level of college baseball
- The odds of playing at each level of college baseball for high school graduates from every state
- An overview of player participation trends compared to the national and regional averages
You can see an overview of our resources, methodology, and limitations on our College Baseball Participation Overview Main Page.
West Region Overview
Deciding what states belong in the “West” was admittedly difficult. There are many ways to divide up the United States and our West Region ended up including only four (4) states. With 52,382 high school baseball participants (44,542 of whom live in California), it is the third least populated of our 7 regions. The West states account for 10.9% of all NFHS high school baseball players nation-wide but graduates from these states make up over 12.5% of all college baseball participants. The probability of players from the West Region moving on to play college baseball at any level (14.52%) is well above the national average (12.58%). In fact, the West’s overall probability ranks 3rd out of the 7 regions, trailing only the Mid-Atlantic (16.38%) and Northeast (15.36%). For the D1, NAIA, and Junior College levels, the probability of West players making it is above average. Most notably, the probability of playing at the JUCO level for the West region is the highest of any region we put together at a whopping 5.94%, nearly a full percent higher than the second-best region (Northwest, 5.0%). The West also has strong D1 representation (2.96%, good for 3rd best). D3 is the only college level where the West falls well below national average, 1.68% compared to 3.10%, respectively. This is likely due in large part to the minimal D3 presences in western states. Among the 4 states, there are only 9 D3 programs. At the D2 level, the West falls just below the national average of 2.05%, coming in with a 1.98% probability of moving on to that level.
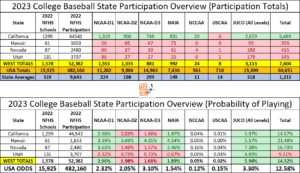
You can see the complete breakdown of the West Region below, where boxes in green are above the national averages and boxes highlighted in red are below the national averages. Due to small overall participation numbers, we did not color code probability boxes for the NCCAA and USCAA levels.
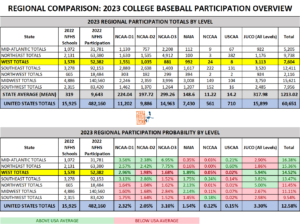
Regional Comparison
Below, you can see how the West matches up against other regions from around the country.
Below we provide an advanced breakdown of each state (listed in alphabetical order). To read the complete article on each state, simply click on the state name!
California
Note: Because California makes up 85% of the West Region’s participant totals, California participation rates closely mirror regional averages. As such, we’ll only make mention of the comparison if relevant.
California is known as a baseball state and the numbers back up this reputation. California (44,542) trails only Texas (52,938) in total high school baseball participants. Even so, California has almost 1,600 more college baseball participants than graduates of the Lone Star State. No other state comes even close to the Golden State’s 6,489 college baseball players across all college levels. Described another way, 10.7% of American-born college baseball players nation-wide hail from the Sunshine State. As you’ve probably guessed, the overall college baseball outlook for California high school graduates across all levels (14.57%) is good, roughly 2% better than the national average of 12.58%.
California’s junior college system (CCCAA) is the main reason behind the state’s college baseball pipeline. There are 88 in-state JUCO programs (not a typo!) to provide opportunities to California’s ballplayers. This results in 5.97% of California high school graduates playing at the junior college level. Just about 40% of all Californian college players are playing at the JUCO level in-state. California trails only Nevada (7.38%) in JUCO participation rate among the 50 states. California’s D1 (2.96%) and NAIA (1.87%) participation rates are also above the respective national averages of 2.32% and 1.54%. Like the West Region overall, California’s D2 participation rate (1.98%) is just below the 2.05% national mark, while its D3 participation rate (1.68%) is the only level to fall substantially below the national average (3.10%).
California’s 155 college programs are the most of any state by a wide margin. The Sunshine State has the most D1 programs (26) and the 2nd most D2 programs (18, trailing only Pennsylvania’s 20) of any state. The 9 in-state D3 programs put it tied for 12th best nationally, but when compared with the in-state player population it supports, the total helps explain the low D3 participation rate. Over 70% of California graduates stay in-state to play in college, but 1,900+ Californian’s still represent schools in other states. It’s no surprise that California has double-digit players in 43 of the 48 states with college baseball.
Hawaii
Hawaii may not have the power in numbers that California does, but that doesn’t stop it from owning the highest college baseball participation rates of any state in the nation. Hawaii has a 21.48% overall college baseball participation rate across all levels, a nod to the proud baseball tradition on the islands. Think about that for a second. Nearly a quarter of Hawaii’s 1,653 high school players will move on to play at the next level. Hawaii joins Illinois as the only states that is above the national average for every major level of college baseball. In fact, the only level where Hawaii isn’t a full percentage above the national average is at the D3 level, where it misses that mark by only .05%. The Aloha State’s state rankings help illustrate just how strong the college baseball pipeline is. Hawaii’s college participation rate ranks 10th for D1 (3.39% versus national average 2.32%), 5th for D2 (3.93% versus national average 2.05%), 16th for D3 (4.05% versus national average 3.10%), 3rd for NAIA (4.54% versus national average 1.54%), and 6th for JUCO (5.57% versus national average 3.30%) among the 50 states. Hawaii has more ballplayers playing in California than it does in-state, a rarity that makes sense given the limited options at home (4 total programs in Hawaii). While the majority of players stay on the west coast, Hawaii state graduates blanket the country from coast-to-coast.
Nevada
Overall, the college baseball outlook for Nevada high school graduates across all levels (16.73%) is better than the Midwest average (14.52%) and national average (12.58%) by a good margin. Nevada’s high probability of playing at the next level is largely due to the 7.38% of players who play at the junior college level. If that sounds high, it is! Nevada sends the highest percentage of graduates to the JUCO level of any state in the country. The probability of playing at the D1 and NAIA levels for Nevada high school graduates is also above national averages for each level. Nevada’s 3.63% D1 participation rate is higher than any state West of the Mississippi and good for 9th nationally, well above the 2.32% national average. It’s NAIA participation rate of 2.46% is almost a full percentage point above the national average of 1.54%, giving it the 11th best mark of any state. Nevada falls short of national averages forD2 (1.49%) and D3 (1.57%) participation. With only 4 in-state college programs, Nevada’s college baseball participation rates may come as a surprise. Many Nevada grads go west for college baseball opportunities. Nearly half of Nevada’s 415 college players are in programs on the west coast. The rest who choose not to stay in-state, blanket the rest of the country fairly evenly.
Utah
Overall, the college baseball outlook for Utah high school graduates across all levels is low (9.31%) when compared to its region (14.52%) and national average (12.58%). In fact, Utah is the only state in the Western Region that is below those marks. In terms of climate and terrain, Utah is a bit of an outlier in the West Region, so it’s last place college participation ranking shouldn’t come as a big surprise. Utah is dead even with the D1 national probability (2.32%), above the national average for JUCO (4.83% to 3.30%), and significantly below the national averages for D2, D3, and NAIA. The respective 0.73%, 0.73%, and 0.67% probability of playing at those levels comes nowhere near the national standard. These totals make sense, since Utah’s 6 in-state college baseball options exist at levels where next level probability is highest (4 D1 and 2 JUCO programs). 1/3 of the Beehive State’s college players attend in-state programs and anyone looking to play at the D2, D3, or NAIA level will have to look elsewhere. About 50% of out of state participants head west to California, Oregon, and Washington.
Limitations
This article was written with data and insights from 3rd party sources, College Baseball Insights and NFHS High School Participation Data. Data and insights are subject to revision and/or change. We’ve attempted to display as accurate a picture as possible with the information that is available. Readers should be aware that college baseball roster data is fluid and changes throughout the year. Every attempt is made to reconcile data and keep up with changes, but this article may not reflect the changes or updates from 3rd parties. Insights cannot account for gap year programs, misreported roster information, or other inaccuracies which may slightly alter the numbers and percentages used in this article. Insights are subject to change and are based on best available information.


