
State Participation Overview: Northeast Region
-
by
KPB
You’re interested in playing college baseball, but what are your chances of making it to the next level? While many tout national probability as gospel, it turns out your odds of playing at the next level vary greatly depending on where you live.
If you live in the Northeast and are wondering what percentage of high school graduates from your state play at each college level and where they are playing, you’ve come to the right place. In this article, we team up with our friends at College Baseball Insights to provide you with state-level overview of your chances to play at the next level.
For each of our Northeast states below, we break down:
- High school baseball participation by state
- Number of HS graduates from each state participating at each level of college baseball
- The odds of playing at each level of college baseball for high school graduates from every state
- An overview of player participation trends compared to the national and regional averages
You can see an overview of our resources, methodology, and limitations on our College Baseball Participation Overview Main Page.
Northeast Region Overview
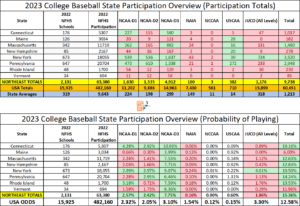
With 63,380 high school baseball participants, the Northeast region is the fourth most populated of our 7 regions. The Northeast states account for 13.1% of all NFHS high school baseball players nation-wide but graduates from these states make up over 16% of all college baseball participants. The probability of players from the Northeast Region moving on to play college baseball at any level (15.36%) is well above the national average (12.58%). In fact, the Northeast’s overall probability ranks 2nd out of the 7 regions, trailing only the Mid-Atlantic region (16.38%).
For the D1, D2, and D3 levels, the probability of Northeast players making it is above average. Most notably, the probability of playing at the D3 level for the Northeast region is the highest of any region we put together at a whopping 7.75%. This nearly a full percent higher than the second-best region (Mid-Atlantic, 6.95%) and more than double the national probability of 3.10%. In fact, the Northeast’s D3 pipeline turns out the highest percent of college players of any level for any region. In addition to its stellar D3 numbers, which are the reason behind the region’s 2nd overall ranking, the Northeast also has strong D1 (2.57%) and D2 representation (2.42%), good for 4th and 2nd best, respectively.
What the Northeast has at the NCAA level, it lacks at every other major college baseball level of play. The Northeast’s NAIA pipeline is the lowest of any region with just .16% of all Northeast high school participants moving on to play at the NAIA level. The Junior college rate for the northeast (1.86%) is also the lowest for that level of any region by a wide margin.
You can see the complete breakdown of the Northeast Region below, where boxes in green are above the national averages and boxes highlighted in red are below the national averages. Due to small overall participation numbers, we did not color code probability boxes for the NCCAA and USCAA levels.
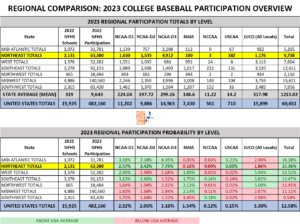
Regional Comparison
Below, you can see how the Northeast matches up against other regions from around the country.
Below we provide an advanced breakdown of each state (listed in alphabetical order). To read the complete article on each state, simply click on the state name!
Connecticut
It may be surprising to find out that Connecticut, in many ways, is the leader of the Northeast’s success at moving players to the next level. Overall, the college baseball outlook for Connecticut graduates moving on to any level of college baseball (19.16%) is well above both national (12.58%) and regional (15.36%) averages. If that total seems really high, it is! Connecticut’s overall probability is the 4th best of any state in the US. The probability of moving on to the D3 level (10.93%) accounts for more than half of the overall total, and is tops of any state in the country. Only Washington DC (11.88%) has a better D3 pipeline in terms of probability. The odds of playing at the D1 level (4.28%) are tops in the region and well above national average of 2.32%. Connecticut also is above average for the region and nationally at moving players to the D2 level, coming in at a 2.92% clip. The state excels across all three NCAA levels, which makes up for well below average marks for the NAIA (0.06%) and JUCO (0.89%) levels. The abundance of NCAA options at all levels throughout New England and the Northeast help explain why the state thrives at those level and falls way short at the others. It makes sense that over 90% of Connecticut high school players stay in the Northeast for college baseball, since there is no shortage of quality options at the D1, D2, and D3 levels.
Maine
Despite having better high school participation numbers than Vermont, Rhode Island, and New Hampshire, the region’s northern-most state’s college baseball outlook is the 2nd worst of any state represented by the NFHS. Only 6% of Maine high school baseball players move on to play at any college level, around a third of the region’s average (15.36%) and half the national average (12.58%). Maine is below average at every major college level with the exception of D3, where a respectable 3.99% of Maine high school ballplayers move on to play. That accounts for two-thirds of Maine’s total college baseball output. Maine’s D2 (0.30%) and JUCO (0.00%) rates are the lowest of any state in the country and is extremely underrepresented at the D1 (0.66%) and NAIA (0.13%) levels. The 0.92% of players from Maine who play at the USCAA level is 2nd best of any state in the country, trailing only Pennsylvania. When you pair long winters with the D3 and USCAA skewed distribution of in-state college baseball options (1 D1, 9 D3’s, 3 USCAA, and zero JUCO or D2 programs), it’s easy to see why Maine trails behind almost every state at most levels. This is especially true given two-thirds of college baseball players from Maine stay in-state to play at the college level. Maine has no college baseball players in programs south of the state of Tennessee or west of Indiana.
Massachusetts
Massachusetts is another Northeastern state who, like the region in general, is above average in overall college baseball participation rate (12.63%) due in large part to a remarkably high D3 participation rate (7.53%). With 34 in-state D3 options, the 3rd most of any state, the numbers start to make sense. Even so, Massachusetts trails regional participation rates at every other major college level. D3 is the only level where it is above the national average. While D1 (2.24%) and D2 (1.41%) participation don’t trail too far behind national averages, NAIA (0.20%) and JUCO (1.12%) participation percentages trail the respective 1.54% and 3.30% rates significantly. With over 1400 college players in total, Massachusetts high school grads play in every state in the entire eastern half of the United States. Unsurprisingly, most stay in the Northeast with 883 playing in their home state. In addition to the 34 D3 programs, Massachusetts is also home to 8 D1’s, 3 D2’s, and 7 JUCO’s.
New Hampshire
If you’ve read our Massachusetts report, this may sound like a carbon copy. The two New England states boast nearly identical participation rates across all levels. Like the region in general, New Hampshire is above average in overall college baseball participation rate (12.83%) due in large part to a remarkably high D3 participation rate (7.71%). With 5 in-state D3 options and another 34 in neighboring Massachusetts, the D3 pipeline makes sense. Also like Massachusetts, New Hampshire trails regional participation rates at every other major college level. D3 is the only level where it is above the national average. While D1 (2.03%) and D2 (1.66%) participation don’t trail too far behind national averages, NAIA (0.09%) and JUCO (0.42%) participation percentages trail the respective 1.54% and 3.30% rates significantly. Like Maine, New Hampshire also has a significantly higher percentage of players (0.92%) who go on to play at the USCAA level. Because of the D3 options that exist in Massachusetts, nearly as many of New Hampshire’s 278 college baseball players head to the southern neighbor as those who stay in-state. New Hampshire has 1 D1, 3 D2, and 2 USCAA programs to go with its 5 D3 programs. There are no in-state JUCO options.
New York
When you think of college baseball pipelines, you likely think about the warm weather states like California, Texas, and Florida. New York has something to say about that. New York’s overall college baseball outlook is very strong. It’s 3,522 college baseball participants across all levels trails only California and Texas despite having only the 7th most high school participants of any state. It’s 19.50% college baseball participation rate is also good for 3rd best in the country behind only Hawaii and Nebraska.
New York doesn’t lean on just one level to get its players to the next level. Across all major college levels except NAIA, New York has very strong numbers. New York’s D2 participation rate (2.97%) is tops in the Northeast while the D1 (2.99%) and D3 (9.07%) participation rates are good for a respective 3rd and 2nd in the region. Even though New York’s 0.24% NAIA participation rate is well below the 1.54% national average, it is still tops in a region that doesn’t send many players to that level. With a 4.01% JUCO participation rate, New York more than doubles the Northeast region’s rate for that level (1.86%) and bests the 3.30% national average easily. New York high school graduates account for 62% (724) of the region’s 1,176 total JUCO players.
New York’s strength across many college levels comes from having great in-state options. The state’s 111 college baseball programs trails only California in total options. This includes 18 D1’s (2nd most of any state), 11 D2’s, 48 D3’s (2nd most), and 31 JUCO programs (3rd most). Two-thirds of New York’s college baseball players stay in-state to play college baseball. Most of the other third stay in the Northeast, but New York is represented in the vast majority of states with college baseball nationwide.
Pennsylvania
Compared to the national average (12.58%), Pennsylvania’s overall college baseball participation rate (14.24%) is strong. This is buoyed by D2 (2.95%) and D3 (6.46%) participation rates that are well above the 2.05% and 3.10% respective national rates for each level. Pennsylvania also has the highest percentage of players who move on to play at the USCAA level (1.31%) of any state in the country. With nearly half of all USCAA schools in-state, the large amount of players who head to that level out of Pennsylvania makes a lot of sense.
While these are positive signs, Pennsylvania’s college participation rates are a bit disappointing when compared to most of the northeastern states. Despite having the largest number of high school baseball participants (20,704) of any state in the Northeast Region and being home to the 3rd most college baseball programs of any state in the country, Pennsylvania’s overall college baseball participation rate (14.24%) is below the region’s average (15.36%). Even Pennsylvania’s D3 participation rate, which is more than double the national average is 2nd lowest for the region. This is especially concerning since the state has more D3 college programs (56) than any other state. Pennsylvania’s D1 participation rate (2.28%) is just under the national (2.32%) and regional (2.57%) averages. The state’s NAIA (0.10%) and junior college (1.13%) participation rates are well below the respective national averages of 1.54% and 3.30%.
Pennsylvania’s 109 total college baseball programs trail only California (154) and New York (111). The Keystone state’s college baseball population takes advantage, with over two-thirds of them playing in programs in-state. The majority of out-of-state college baseball players from Pennsylvania stick around the northeast and mid-Atlantic states.
Rhode Island
13.53% of Rhode Island high school players move on to play college baseball at any level. This is above the 12.58% national average and below the Northeast Region’s 15.36% average. The state has the 2nd fewest high school baseball players in the region, with only 48 high school programs and 1,700 high school baseball participants. What the state lacks in participation, it makes up for with quality. Rhode Island’s 3.18% D1 participation rate is good for second best in the region and well above both national (2.32%) and regional (2.57%) averages. The states D3 participation rate of 7.59% is well above the national average (3.10%) and just slightly below the regional average (7.75%). With only 12 D2 players and 3 NAIA players from Rhode Island, the state’s respective 0.71% and 0.18% participation rates for each level are well below national marks, although the Northeast Region in general has very low NAIA participation rates (0.16%). Rhode Island has the 3rd best junior college participation of the northeast states at 1.76%, which is still significantly below the 3.30% national average at the level. The state has 3 D1 programs, 4 D3 programs, and 1 junior college program. It’s unsurprising that the vast majority of Rhode Island’s 230 college players stay in the Northeast, but mainly travel north to play ball. Very few play south of Connecticut, Rhode Island’s neighbor to the south.
Vermont
For a small northern state with cold weather, Vermont moves a respectable 11.96% of it’s high school players on to the college level. Vermont’s 8.36% D3 participation rate is good for 3rd best in the region and nearly 3 times the national average of 3.10%. For all remaining levels, Vermont falls below the national and regional averages. In order from highest to lowest participation rates, the Great Mountain State has 1.73% D2, 1.59% D1, 0.29% junior college, and 0.0% NAIA participation rates. Vermont’s 1 D2 and 4 D3 programs are home to 29 of the state’s 83 college baseball players. Only 7 of those 83 players attend schools outside of our Northeast Region states.
Limitations
This article was written with data and insights from 3rd party sources, College Baseball Insights and NFHS High School Participation Data. Data and insights are subject to revision and/or change. We’ve attempted to display as accurate a picture as possible with the information that is available. Readers should be aware that college baseball roster data is fluid and changes throughout the year. Every attempt is made to reconcile data and keep up with changes, but this article may not reflect the changes or updates from 3rd parties. Insights cannot account for gap year programs, misreported roster information, or other inaccuracies which may slightly alter the numbers and percentages used in this article. Insights are subject to change and are based on best available information.


