

2023 State Participation Overview: Pennsylvania
-
by
KPB
You’re interested in playing college baseball, but what are your chances of making it to the next level? While many tout national probability as gospel, it turns out your odds of playing at the next level vary greatly depending on where you live.
If you live in Pennsylvania and are wondering what percentage of high school graduates from your state play at each college level and where they are playing, you’ve come to the right place. In this article, we team up with our friends at College Baseball Insights to provide you with state-level overview of your chances to play at the next level.
You can see an overview of our resources, methodology, and limitations on our College Baseball Participation Overview Main Page, as well find overviews on other states and regions.
Pennsylvania
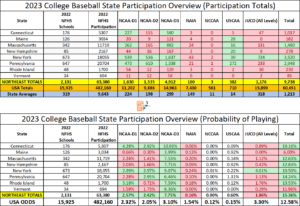
In the table below, you’ll see how many high school players from Pennsylvania are playing at each level of college baseball, the probability of playing at each college level, and how Pennsylvania compares nationally and to other states in the Northeast Region. You can see the complete Northeast breakdown HERE.
Where Are They Playing?
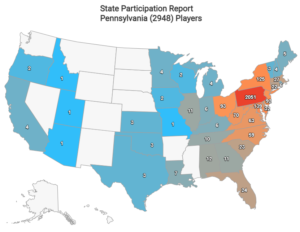
Pennsylvania Players by Division (2,948)
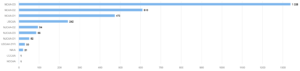
Image and data credit: College Baseball Insights
The Breakdown
Compared to the national average (12.58%), Pennsylvania’s overall college baseball participation rate (14.24%) is strong. This is buoyed by D2 (2.95%) and D3 (6.46%) participation rates that are well above the 2.05% and 3.10% respective national rates for each level. Pennsylvania also has the highest percentage of players who move on to play at the USCAA level (1.31%) of any state in the country. With nearly half of all USCAA schools in-state, the large amount of players who head to that level out of Pennsylvania makes a lot of sense.
While these are positive signs, Pennsylvania’s college participation rates are a bit disappointing when compared to most of the northeastern states. Despite having the largest number of high school baseball participants (20,704) of any state in the Northeast Region and being home to the 3rd most college baseball programs of any state in the country, Pennsylvania’s overall college baseball participation rate (14.24%) is below the region’s average (15.36%). Even Pennsylvania’s D3 participation rate, which is more than double the national average is 2nd lowest for the region. This is especially concerning since the state has more D3 college programs (56) than any other state. Pennsylvania’s D1 participation rate (2.28%) is just under the national (2.32%) and regional (2.57%) averages. The state’s NAIA (0.10%) and junior college (1.13%) participation rates are well below the respective national averages of 1.54% and 3.30%.
Pennsylvania’s 109 total college baseball programs trail only California (154) and New York (111). The Keystone state’s college baseball population takes advantage, with over two-thirds of them playing in programs in-state. The majority of out-of-state college baseball players who hail from Pennsylvania stick around the northeast and mid-Atlantic states.
Want to see additional states and regional breakdowns? Find them HERE.
Limitations
This article was written with data and insights from 3rd party sources, College Baseball Insights and NFHS High School Participation Data. Data and insights are subject to revision and/or change. We’ve attempted to display as accurate a picture as possible with the information that is available. Readers should be aware that college baseball roster data is fluid and changes throughout the year. Every attempt is made to reconcile data and keep up with changes, but this article may not reflect the changes or updates from 3rd parties. Insights cannot account for gap year programs, misreported roster information, or other inaccuracies which may slightly alter the numbers and percentages used in this article. Insights are subject to change and are based on best available information.


