
2023 State Participation Overview: California
-
by
KPB
You’re interested in playing college baseball, but what are your chances of making it to the next level? While many tout national probability as gospel, it turns out your odds of playing at the next level vary greatly depending on where you live.
If you live in California and are wondering what percentage of high school graduates from your state play at each college level and where they are playing, you’ve come to the right place. In this article, we team up with our friends at College Baseball Insights to provide you with state-level overview of your chances to play at the next level.
You can see an overview of our resources, methodology, and limitations on our College Baseball Participation Overview Main Page, as well find overviews on other states and regions.
California by the Numbers
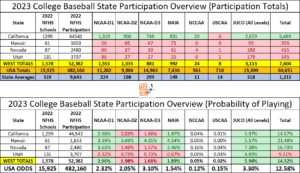
In the table below, you’ll see how many high school players from California are playing at each level of college baseball, the probability of playing at each college level, and how California compares nationally and to other states in the West Region. You can see the complete West breakdown HERE.
Where Are They Playing?
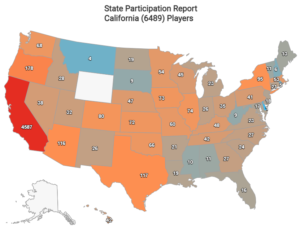
California Players by Division (6,489)
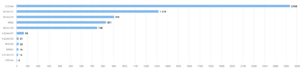
Image and data credit: College Baseball Insights
The Breakdown
Note: Because California makes up 85% of the West Region’s participant totals, California participation rates closely mirror regional averages. As such, we’ll only make mention of the comparison if relevant.
California is known as a baseball state and the numbers back up this reputation. California (44,542) trails only Texas (52,938) in total high school baseball participants. Even so, California has almost 1,600 more college baseball participants than graduates of the Lone Star State. No other state comes even close to the Golden State’s 6,489 college baseball players across all college levels. Described another way, 10.7% of American-born college baseball players nation-wide hail from the Golden State. As you’ve probably guessed, the overall college baseball outlook for California high school graduates across all levels (14.57%) is good, roughly 2% better than the national average of 12.58%.
California’s robust junior college system (CCCAA) is the main reason behind the state’s college baseball pipeline. There are 88 in-state JUCO programs (not a typo!) to provide opportunities to California’s ballplayers. This results in 5.97% of California high school graduates playing at the junior college level. Just about 40% of all Californian college ballplayers (2,536 in total) are playing at the JUCO level in-state. California trails only Nevada (7.38%) in JUCO participation rate among the 50 states. California’s D1 (2.96%) and NAIA (1.87%) participation rates are also above the respective national averages of 2.32% and 1.54%. Like the West Region overall, California’s D2 participation rate (1.98%) is just below the 2.05% national mark, while its D3 participation rate (1.68%) is the only level to fall substantially below the national average (3.10%).
California’s 155 college programs are the most of any state by a wide margin. The Sunshine State has the most D1 programs (26) and the 2nd most D2 programs (18, trailing only Pennsylvania’s 20) of any state. The 9 in-state D3 programs put it tied for 12th best nationally, but when compared with the in-state player population it supports, the total helps explain the low D3 participation rate. Over 70% of California graduates stay in-state to play in college, but 1,900+ Californian’s still represent schools in other states. It’s no surprise that California has player representation in all 48 states with college baseball and double-digit player participation in 43 of the 48 states..
Want to see additional states and regional breakdowns? Find them HERE.
Limitations
This article was written with data and insights from 3rd party sources, College Baseball Insights and NFHS High School Participation Data. Data and insights are subject to revision and/or change. We’ve attempted to display as accurate a picture as possible with the information that is available. Readers should be aware that college baseball roster data is fluid and changes throughout the year. Every attempt is made to reconcile data and keep up with changes, but this article may not reflect the changes or updates from 3rd parties. Insights cannot account for gap year programs, misreported roster information, or other inaccuracies which may slightly alter the numbers and percentages used in this article. Insights are subject to change and are based on best available information.


