

2023 State Participation Overview: Louisiana
-
by
KPB
You’re interested in playing college baseball, but what are your chances of making it to the next level? While many tout national probability as gospel, it turns out your odds of playing at the next level vary greatly depending on where you live.
If you live in Louisiana and are wondering what percentage of high school graduates from your state play at each college level and where they are playing, you’ve come to the right place. In this article, we team up with our friends at College Baseball Insights to provide you with state-level overview of your chances to play at the next level.
You can see an overview of our resources, methodology, and limitations on our College Baseball Participation Overview Main Page, as well find overviews on other states and regions.
Louisiana by the Numbers
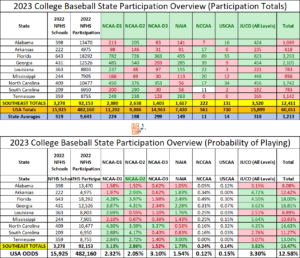
In the table below, you’ll see how many high school players from Louisiana are playing at each level of college baseball, the probability of playing at each college level, and how Louisiana compares nationally and to other states in the Southeast Region. You can see the complete Southwest breakdown HERE.
Where Are They Playing?
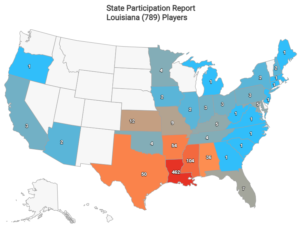
Louisiana Players by Division (798)
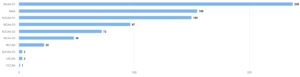
Image and data credit: College Baseball Insights
The Breakdown
While the state of Louisiana may have a few College World Series championships under its belt, it’s 8.89% overall college baseball participation rate is the second lowest in the region and well below the national average of 12.58%. The state’s 2.69% D1 participation rate is above the national average, but good for only 7th in the region. The NAIA (1.76%, 5th in the region) is the only level where Louisiana is above both the national and regional averages. Louisiana is below national and regional averages for D2 (0.55%, last in region), D3 (1.10%, 5th in the region), and JUCO (2.51%, last in the region). With 12 D1, zero D2, 1 D3, 7 NAIA, and 5 JUCO programs in-state, it’s easy to see why the state doesn’t do better job of moving more of its nearly 9,000 high school participants to the next level. Like everywhere, the players follow the opportunity and its unsurprising to find out that the levels where the most opportunity exists (D1 and NAIA) are the levels where it does best.
Want to see additional states and regional breakdowns? Find them HERE.
Limitations
This article was written with data and insights from 3rd party sources, College Baseball Insights and NFHS High School Participation Data. Data and insights are subject to revision and/or change. We’ve attempted to display as accurate a picture as possible with the information that is available. Readers should be aware that college baseball roster data is fluid and changes throughout the year. Every attempt is made to reconcile data and keep up with changes, but this article may not reflect the changes or updates from 3rd parties. Insights cannot account for gap year programs, misreported roster information, or other inaccuracies which may slightly alter the numbers and percentages used in this article. Insights are subject to change and are based on best available information.


