
State Participation Overview: Northwest Region
-
by
KPB
You’re interested in playing college baseball, but what are your chances of making it to the next level? While many tout national probability as gospel, it turns out your odds of playing at the next level vary greatly depending on where you live.
If you live in the Northwest and are wondering what percentage of high school graduates from your state play at each college level and where they are playing, you’ve come to the right place. In this article, we team up with our friends at College Baseball Insights to provide you with state-level overview of your chances to play at the next level.
For each of our Northwestern states below, we break down:
- High school baseball participation by state
- Number of HS graduates from each state participating at each level of college baseball
- The odds of playing at each level of college baseball for high school graduates from every state
- An overview of player participation trends compared to the national and regional averages
You can see an overview of our resources, methodology, and limitations on our College Baseball Participation Overview Main Page.
Northwest Overview
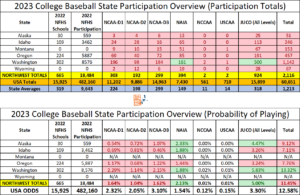
The Northwest region only has six states, but only four are represented by the NFHS. With 18,484 high school baseball participants, it is by far the least populated of any of our 7 regions. The Northwest states account for just 3.8% of all NFHS high school baseball players nation-wide but graduates from these states only make up 3.5% of college baseball participants. The probability of Northwest players moving on to play college baseball at any level (11.45%) is below the national average (12.58%). In fact, Northwest’s overall probability ranks 5th out of the 7 regions, ahead of only the Southwest (9.54%) and Midwest (11.11%). For each level of college baseball except NAIA and junior college, the probability for playing among Northwest players is below average. Most notably, the probability of playing D2 for the Northwest region is the lowest of any other region we put together at 1.04%, almost half the national average (2.05%). The Northwest does have very strong JUCO representation (5.0%), which is 2nd best among the 7 regions and well above the national probability (3.30%). The Northwest is also strong at sending players to the NAIA level (2.13%) compared to the national average (1.54%).
You can see the complete breakdown of the Northwest below, where boxes in green are above the national averages and boxes highlighted in red are below the national averages. Due to small overall participation numbers, we did not color code probability boxes for the NCCAA and USCAA levels.
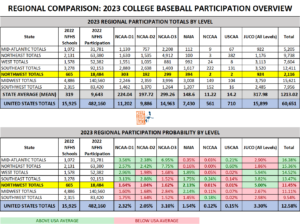
Regional Comparison
Below, you can see how the Northwest matches up against other regions from around the country.
Below we provide an advanced breakdown of each state (listed in alphabetical order). To read the complete article on each state, simply click on the state name!
Alaska
It should come as no surprise that the overall probability of playing college baseball for Alaska residents (9.12%) is below the national average (12.58%). Alaska’s 559 high school baseball participants are the lowest of any state monitored by NFHS. Despite dealing with bad weather and long distances to travel for games, Alaska is above average at sending playing to the NAIA (2.33%) and junior college (4.47%) levels compared to the national averages of 1.54% and 3.30%, respectively. Alaska has players represented at every major college level with the 25 JUCO players and 13 NAIA players representing the highest totals. All 51 graduates from the state of Alaska in college baseball play outside of Alaska since there are no in-state college baseball programs.
Idaho
Overall, the college baseball outlook for Idaho high school graduates across all levels (7.11%) is well below both Northwest (11.45%) and national (12.58%) averages. In fact, Idaho has the 3rd lowest college baseball participation rate of any state. The only level where Idaho is above the national average at sending players to the next level is NAIA. It’s 1.88% NAIA participation rate is just north of the national odds (1.54%) but below the regional average (2.13%). The junior college participation rate of 3.26% is just about on par with the national average of 3.30%, but all other levels fall well below 1%. While it may surprise you to find that Idaho has 3,462 high school baseball participants, this clearly isn’t translating to creating a pipeline to college baseball. With only 4 in-state programs, these results aren’t all together surprising. Idaho is a rare state where more players play in other states than stay home. Both Oregon and Washington get more Idaho graduates than those who stay in-state to play in college.
Montana
Montana has its own high school baseball association, so high school player participation data from NFHS and post high school playing probability for the state is not available. When we look at the overall number of Montana high school grads playing college baseball (153), it’s no surprise that the raw totals are among the fewest of any state. Montana is the 7th least populated state in the United States and has some of the harshest weather to boot. Even so, Montana has players represented in every major level of college baseball. Most Montana ballplayers are playing at the junior college (67) or NAIA (51) levels. The state has one D2 program, and two JUCO programs.
Oregon
Overall, the college baseball outlook for Oregon high school graduates across all levels (7.76%) is well below the Northwest (11.45%) and national (12.58%) averages. With 22 in-state college baseball programs for under 5,887 high school baseball participants, and two nationally known programs in University of Oregon and Oregon State, Oregon’s overall college baseball participation rate is surprising. As we’ve seen with many other states, poor weather may have a big role in the poor numbers. Oregon is below national and Northwest region averages at every single college level. In fact, Oregon’s junior college participation rate of 3.24% is the only one that is even close. D1 (1.17%), D2 (0.68%), D3 (1.22%), and NAIA (1.44%) are all well below the national mark.
Washington
Overall, the college baseball outlook for Washington state high school graduates across all levels (13.32%) is better than the Northwest (11.45%) and national (12.58%) average. Washington state’s quality junior college system (NWAC) is a huge reason behind the college baseball pipeline. The 18 in-state JUCO programs are a big reason why 5.83% of Washington state graduates go on to play at the junior college level. That trails only California and Nevada in JUCO participation rate for all states. Washington’s 1.88% NAIA participation rate is below the regional average (2.13%) but above the national average (1.54%). All other level are above the regional average but below the national average. There are 4 in-state D1 programs and Washington state’s 2.29% D1 participation rate is just below the national average (2.32%). The low D2 participation rate (1.14%, just better than half of the national average) may have something to do with there being only 2 in-state D2 programs and few programs in neighboring states. Over two-thirds of Washington’s college baseball participants stay on the west coast. The remaining third blanket the country in a remarkably even way. Only 4 states that have college baseball programs aren’t represented by state of Washington grads.
Wyoming
Wyoming has its own high school baseball association, so high school player participation data from NFHS and post high school playing probability for the state is not available. When we look at the overall number of Wyoming grads playing college baseball (67), it’s no surprise that the raw totals are the second fewest of any state. Wyoming is the least populated state in the United States and has some of the harshest weather to boot. Even so, Wyoming has players represented in every major level of college baseball. Most Wyoming ballplayers are playing at the junior college (28) or NAIA (19) levels. The state has no college baseball programs, so anyone looking to play at the next level will have to play out of state.
Limitations
This article was written with data and insights from 3rd party sources, College Baseball Insights and NFHS High School Participation Data. Data and insights are subject to revision and/or change. We’ve attempted to display as accurate a picture as possible with the information that is available. Readers should be aware that college baseball roster data is fluid and changes throughout the year. Every attempt is made to reconcile data and keep up with changes, but this article may not reflect the changes or updates from 3rd parties. Insights cannot account for gap year programs, misreported roster information, or other inaccuracies which may slightly alter the numbers and percentages used in this article. Insights are subject to change and are based on best available information.


