
State Participation Overview: Mid-Atlantic Region
-
by
KPB
You’re interested in playing college baseball, but what are your chances of making it to the next level? While many tout national probability as gospel, it turns out your odds of playing at the next level vary greatly depending on where you live.
If you live in the Mid-Atlantic region and are wondering what percentage of high school graduates from your state play at each college level and where they are playing, you’ve come to the right place. In this article, we team up with our friends at College Baseball Insights to provide you with state-level overview of your chances to play at the next level.
For each of our Mid-Atlantic states below, we break down:
- High school baseball participation by state
- Number of HS graduates from each state participating at each level of college baseball
- The odds of playing at each level of college baseball for high school graduates from every state
- An overview of player participation trends compared to the national and regional averages
You can see an overview of our resources, methodology, and limitations on our College Baseball Participation Overview Main Page.
Mid-Atlantic Region Overview
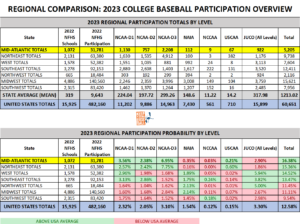
With 31,781 high school baseball participants, the Mid-Atlantic region is the 2nd least populated of our 7 regions. The Mid-Atlantic states account for 6.6% of all NFHS high school baseball players nation-wide but graduates from these states make up over 8.6% of all college baseball participants. The probability of players from the Mid-Atlantic Region moving on to play college baseball at any level (16.38%) is well above the national average (12.58%). In fact, the Mid-Atlantic’s overall probability is the very best out of the 7 regions, ahead of 2nd place Northeast (15.36) by over a full percent. There are many similarities between the Northeast and Mid-Atlantic regions, but every state with the exception of West Virginia has incredibly strong overall totals.
The top ranked region for sending players to the next level builds its 16.38% college baseball participation rate on the back of strong marks for NCAA levels. At the D1 level, the Mid-Atlantic ranks first among all regions, with a participation rate of 3.56%. That’s well above the 2.32% national rate, and .43% higher than the second-place Southeast region. The Mid-Atlantic ranks 3rd among all regions for D2 participation at 2.42%, above the 2.05% national average. Like the Northeast (7.75%), more than one-third of all the Mid-Atlantic region’s college baseball players participate at the D3 level. The 6.95% D3 participation rate ranks behind only the Northeast and over 4% higher than third-place Midwest region! To put that in perspective, the national D3 probability is 3.10%. While not significant in quantity, it should also be noted that .21% of Mid-Atlantic high school players end up at the USCAA level, which is good for second among the 7 regions, trailing only the Northeast.
While the Mid-Atlantic region excels at sending players to every NCAA level, it is below average for the junior college level and significantly below average for NAIA. In this way, it mirrors the neighboring Northeast region again. The Mid-Atlantic’s NAIA pipeline is the second lowest of any region with just .35% of all Mid-Atlantic high school participants moving on to play at the NAIA level. This is well below the 1.54% national average at the NAIA level. The Junior college rate for the northeast (2.90%) is also the third-lowest for that level of any region, but not too far below the 3.30% national rate.
With many college programs at every level not too far away, the Mid-Atlantic is a great place to live if you want to play at the next level.
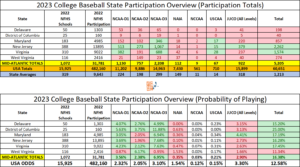
You can see the complete breakdown of the Mid-Atlantic Region below, where boxes in green are above the national averages and boxes highlighted in red are below the national averages. Due to small overall participation numbers, we did not color code probability boxes for the NCCAA and USCAA levels.
Regional Comparison
Below, you can see how the Mid-Atlantic matches up against other regions from around the country.
Below we provide an advanced breakdown of each state (listed in alphabetical order). To read the complete article on each state, simply click on the state name!
Delaware
Delaware has only 1303 high school baseball participants but almost 200 college players. That’s good for a 15.20% overall college baseball participation rate across all levels. That’s below the 16.38% regional average, but well above the national average of 12.58%. Delaware college participation rates are above both national and regional averages at the D1 (4.07%) and D2 (2.76%) levels. Delaware’s 4.99% D3 participation rate is well above the 3.10% national average but below the regional rate of 6.95%. Interestingly, there are no players from Delaware playing at the NAIA level. Delaware joins Vermont as the only states without any NAIA representation. Delaware high school ballplayers move on to the JUCO level at 3.15%, which is better than the regional average (2.90%) but below the national average (3.30%).
Maryland
Maryland’s overall college participation rate of 17.19% is 2nd best in the region and significantly above the national average of 12.58%. It builds on incredibly high D3 (6.94%) and JUCO (4.41%) participation rates. While the D3 marks are on par with regional average (6.95%), JUCO is where Maryland separates itself. It’s the only state in the region above the national rate (3.30%) and 1.26% better than Delaware, the Mid-Atlantic’s 2nd best JUCO pipeline. Maryland’s 0.34% USCAA participation rate is tops in the region as well. At the D2 level, Maryland is dead even with the national average of 2.05% participation, which is slightly behind the region’s 2.38% average. NAIA participation is the only place where Maryland really struggles, with only 0.36% of it’s baseball players participating at that level. Maryland hosts 7 D1, 1 D2, 7 D3, and 14 JUCO programs in-state, offering plenty of options for the 4,985 high school participants to move on. Factor in Maryland’s close proximity to other states with great college options and you begin to see why the state is so good at sending players to the next level.
New Jersey
New Jersey plays host to the biggest high school baseball population in the Mid-Atlantic region with 13,895 participants. That’s roughly 5,000 more high school players than Virginia, who has the second most participants in the region. New Jersey’s overall college baseball participation of 16.28% is well above the national average of 12.58% and just a tick below the regional average of 16.38%.
With 8 D1’s and 15 D3’s in-state, it’s no surprise that this is where the garden state thrives at sending players to the next level. New Jersey has 3.69% D1 and 7.68% D3 participation rates, better than both respective regional (3.56% and 6.95%) and national averages (2.32% and 3.10%). The D3 rate is tops among all states in the region. At the D2 (1.96%), NAIA (0.10%), and JUCO (2.73%) levels, New Jersey is below both regional and national averages. For those respective levels, New Jersey ranks last, second to last, and 3rd to last when compared to other states in the region. With no in-state NAIA options and only 3 D2’s, the low participation for those levels make sense. With 14 in-state JUCO options, it would seem like the JUCO participation would be better, but 14 simply isn’t enough to support a relatively large playing population. Maryland, for example, has nearly a 3rd of the high school participation but the same number of JUCO programs in-state. Even with strained pipelines to certain levels, New Jersey excels at getting players to the next level and would be the leading state for many other regions!
Virginia
Virginia’s 17.45% college baseball participation rate is the best of the region outside of Washington DC and almost 5% points higher than the national average of 12.58%. Virginia is above national and regional averages at both the D1 (4.23%) and D3 (7.63%) levels, where it is 1st and 2nd in regional rankings for each level when you exclude DC. Virginia is also above the national average (2.05%) at the D2 level, sending 2.12% of players to play D2. While Virginia’s 0.47% NAIA participation rate is nothing to write home about, it is above the regional average of 0.35% and good for second-best among Mid-Atlantic states. At the JUCO level, Virginia falls short of national (3.30%) and regional (2.90%) averages, sending only 2.63% of players to play junior college ball. Virgina emerging as leader of the strongest region likely stems from having a lot of college programs relative to the 9,022 high school baseball players the state has. Virgina has 13 D1, 3 D2, 16 D3, 1 NAIA, 7 JUCO, and 2 USCAA programs in-state. The USCAA programs translate to a .31% participation rate at that level, which is more than double the national average.
Washington DC
We’ll keep our DC blurb short and to the point because there are only 160 NFHS baseball participants in the District. These participants have a whopping 25% probability of playing at the next level. DC has a 5.63% D1, 3.75% D2, 11.88% D3, 0.63% NAIA, and 3.13% junior college participation rates. It’s a small sample size, but players from DC are moving on to the college level at a rate higher than every other state.
West Virginia
West Virginia is the only state in the Mid-Atlantic whose overall college baseball participation rate (11.34%) is below the national average (12.58%). Even so, West Virginia holds its own for a state with remote stretches, difficult weather, and less than 3,000 high school baseball participants. West Virginia high school players benefit from 12 in-state D2 baseball programs, a huge number compared to the participation totals. With lots of options, it’s no surprise that West Virginia’s 6.17% D2 participation rate blows the national (2.05%) and regional (2.38%) averages away. West Virginia leads the region and country as a D2 pipeline by a huge margin. Georgia boasts the second-best D2 participation rate at 4.3%, showing just how strong West Virginia is at this level. At the NAIA level, West Virginia’s 1.53% participation rate is just about even with the national average of 1.54% and well above the 0.35% Mid-Atlantic region average, in spite only 1 in-state NAIA option. At the D1 (0.87%), D3 (0.95%), and JUCO (1.66%) levels, West Virginia is last in regional ranking and well below national averages for each level. A close look at the in-state options for these levels (2 D1, 1 D3, and 1 JUCO) helps explain these low totals.
Limitations
This article was written with data and insights from 3rd party sources, College Baseball Insights and NFHS High School Participation Data. Data and insights are subject to revision and/or change. We’ve attempted to display as accurate a picture as possible with the information that is available. Readers should be aware that college baseball roster data is fluid and changes throughout the year. Every attempt is made to reconcile data and keep up with changes, but this article may not reflect the changes or updates from 3rd parties. Insights cannot account for gap year programs, misreported roster information, or other inaccuracies which may slightly alter the numbers and percentages used in this article. Insights are subject to change and are based on best available information.


