
2023 State Participation Overview: Arkansas
-
by
KPB
You’re interested in playing college baseball, but what are your chances of making it to the next level? While many tout national probability as gospel, it turns out your odds of playing at the next level vary greatly depending on where you live.
If you live in Arkansas and are wondering what percentage of high school graduates from your state play at each college level and where they are playing, you’ve come to the right place. In this article, we team up with our friends at College Baseball Insights to provide you with state-level overview of your chances to play at the next level.
You can see an overview of our resources, methodology, and limitations on our College Baseball Participation Overview Main Page, as well find overviews on other states and regions.
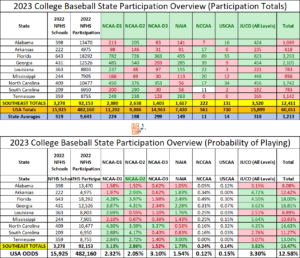
Arkansas by the Numbers
In the table below, you’ll see how many high school players from Arkansas are playing at each level of college baseball, the probability of playing at each college level, and how Arkansas compares nationally and to other states in the Southeast Region. You can see the complete Southwest breakdown HERE.
Where Are They Playing?
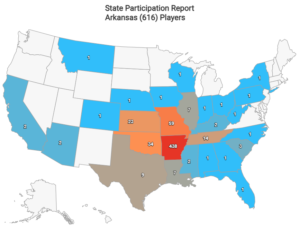
Arkansas Players by Division (616)
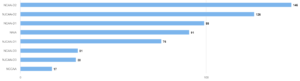
Image and data credit: College Baseball Insights
The Breakdown
Arkansas’ 4,975 high school baseball participants are the fewest of any state in the Southeast region but 30 total in-state college baseball opportunities help the state’s 12.42% overall college baseball participaiton rate hover close to the national (12.58%) and regional (13.47%) averages. Arkansas is above both national and regional averages for the D2 (2.93%), NAIA (1.83%), and JUCO (4.72%) levels. That’s good for 5th, 4th, and 2nd best among the 9 states in the region, respectively. Arkansas also ranks 2nd regionally for the NCCAA level at 0.34%. For the D1 (1.97%) and D3 (0.62%) levels, participation rates fall below national and regional averages. Those rates are the 2nd and 3rd worst in the region, respectively. As previously mentioned, the 5 D1, 7 D2, 3 D3, 5 NAIA, and 8 JUCO’s in-state provide good options for a relatively small playing population.
Want to see additional states and regional breakdowns? Find them HERE.
Limitations
This article was written with data and insights from 3rd party sources, College Baseball Insights and NFHS High School Participation Data. Data and insights are subject to revision and/or change. We’ve attempted to display as accurate a picture as possible with the information that is available. Readers should be aware that college baseball roster data is fluid and changes throughout the year. Every attempt is made to reconcile data and keep up with changes, but this article may not reflect the changes or updates from 3rd parties. Insights cannot account for gap year programs, misreported roster information, or other inaccuracies which may slightly alter the numbers and percentages used in this article. Insights are subject to change and are based on best available information.


