

2023 State Participation Overview: Texas
-
by
KPB
You’re interested in playing college baseball, but what are your chances of making it to the next level? While many tout national probability as gospel, it turns out your odds of playing at the next level vary greatly depending on where you live.
If you live in Texas and are wondering what percentage of high school graduates from your state play at each college level and where they are playing, you’ve come to the right place. In this article, we team up with our friends at College Baseball Insights to provide you with state-level overview of your chances to play at the next level.
You can see an overview of our resources, methodology, and limitations on our College Baseball Participation Overview Main Page, as well find overviews on other states and regions.
Texas by the Numbers
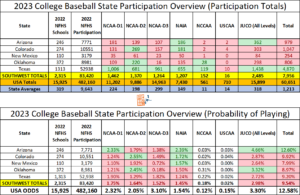
In the table below, you’ll see how many high school players from Texas are playing at each level of college baseball, the probability of playing at each college level, and how Texas compares nationally and to other states in the Southwest Region. You can see the complete Southwest breakdown HERE.
Where Are They Playing?
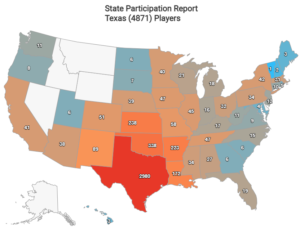
Texas Players by Division (4871)
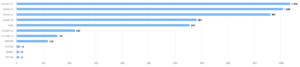
Image and data credit: College Baseball Insights
The Breakdown
Everything is bigger in Texas, right? When it comes to high school baseball participation, that’s undoubtedly true. Texas has a whopping 52,938 high school baseball players. The Lone Star State also has 94 college programs in-state, including 22 D1’s, 9 D2’s, 16 D3’s, 10 NAIA’s, 2 NCCAA, and 35 JUCO’s. While that sounds like a lot, it’s not nearly enough to support the robust high school baseball numbers. California, by comparison, has 61 more college programs in-state for 8,000 fewer high school baseball participants. While everyone knows Texas boasts some of the best programs baseball has to offer from Little League to the Big Leagues, and certainly at every level of college baseball, the state’s sub-par college baseball participation rates boil down to a simple supply and demand issue.
Texas’ overall college baseball participation rate of 9.20% ranks 3rd in the Southwest behind both Arizona and Colorado. That’s more than 2 full percentage points below the national participation rate of 12.58%. In fact, Texas doesn’t have a single major level of college baseball where its participation rate is greater than the national average. At the D1 level, its 1.90% participation rate is 2nd in the region and above the regional average (1.75%), but below the 2.32% national average. Texas’ 1.82% D3 participation rate is tops in the Southwest, which has an average participation rate of 1.52% for the D3 level. At the D2 (1.29%, last in the region), NAIA (1.24%, last in the region), and JUCO (2.72%, 2nd to last in the region) levels, Texas doesn’t perform well comparatively. Texas’ 0.22% participation rate at the NCCAA level is above national average and good for 2nd in the region, but that’s only talking about 119 players from Texas playing at that level.
So how should we judge Texas compared to the other big baseball states? Texas’ college baseball participation rates are low, there’s no doubting that. Still, Texas high school graduates are impacting programs in every state at every level. With 4,870 players in college baseball, Texas trails only California in-terms of total number of players moving on to college baseball. If that’s not a significant impact, I’m not sure what is. We’ll leave the final judgment on the Lone Star State’s college baseball pipeline up to you.
Want to see additional states and regional breakdowns? Find them HERE.
Limitations
This article was written with data and insights from 3rd party sources, College Baseball Insights and NFHS High School Participation Data. Data and insights are subject to revision and/or change. We’ve attempted to display as accurate a picture as possible with the information that is available. Readers should be aware that college baseball roster data is fluid and changes throughout the year. Every attempt is made to reconcile data and keep up with changes, but this article may not reflect the changes or updates from 3rd parties. Insights cannot account for gap year programs, misreported roster information, or other inaccuracies which may slightly alter the numbers and percentages used in this article. Insights are subject to change and are based on best available information.


