

2023 State Participation Overview: Indiana
-
by
KPB
You’re interested in playing college baseball, but what are your chances of making it to the next level? While many tout national probability as gospel, it turns out your odds of playing at the next level vary greatly depending on where you live.
If you live in Indiana and are wondering what percentage of high school graduates from your state play at each college level and where they are playing, you’ve come to the right place. In this article, we team up with our friends at College Baseball Insights to provide you with state-level overview of your chances to play at the next level.
You can see an overview of our resources, methodology, and limitations on our College Baseball Participation Overview Main Page, as well find overviews on other states and regions.
Indiana by the Numbers
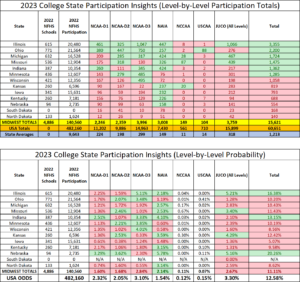
In the table below, you’ll see how many high school players from Indiana are playing at each level of college baseball, the probability of playing at each college level, and how Indiana compares nationally and to other states in the Midwest Region. You can see the complete Midwest breakdown HERE.
Where Are They Playing?
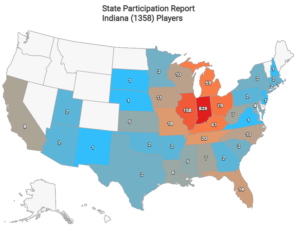
Indiana Players by Division (1358)
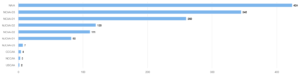
Image and data credit: College Baseball Insights
The Breakdown
Overall, the college baseball outlook for Indiana high school graduates across all levels (13.15%) is better than the Midwest average (11.11%) and national average (12.58%). Indiana is above national probability of playing at the D1, D3, and NAIA levels. Indiana’s 4.1% rate of sending graduates to junior college programs ranks 3rd out of all 50 states and is well above the Midwest average (2.14%) and national averages (1.54%). Where Indiana falls short of national marks appears to be due in part to having very few in-state options. There are two NCAA D2 programs and 2 junior college options in the Hoosier state, limiting opportunities since 843 of the state’s 1,362 college baseball players stay in-state. Players interested in playing at those levels will have to work hard to get in front of coaches both in and out of state.
Want to see additional states and regional breakdowns? Find them HERE.
Limitations
This article was written with data and insights from 3rd party sources, College Baseball Insights and NFHS High School Participation Data. Data and insights are subject to revision and/or change. We’ve attempted to display as accurate a picture as possible with the information that is available. Readers should be aware that college baseball roster data is fluid and changes throughout the year. Every attempt is made to reconcile data and keep up with changes, but this article may not reflect the changes or updates from 3rd parties. Insights cannot account for gap year programs, misreported roster information, or other inaccuracies which may slightly alter the numbers and percentages used in this article. Insights are subject to change and are based on best available information.


