You’re interested in playing college baseball, but what are your chances of making it to the next level? While many tout national probability as gospel, it turns out your odds of playing at the next level vary greatly depending on where you live.
If you live in the Midwest and are wondering what percentage of high school graduates from your state play at each college level and where they are playing, you’ve come to the right place. In this article, we team up with our friends at College Baseball Insights to provide you with state-level overview of your chances to play at the next level.
For each of our Midwestern states below, we break down:
- High school baseball participation by state
- Number of HS graduates from each state participating at each level of college baseball
- The odds of playing at each level of college baseball for high school graduates from every state
- An overview of player participation trends compared to the national and regional averages
You can see an overview of our resources, methodology, and limitations on our College Baseball Participation Overview Main Page.
Midwest Overview
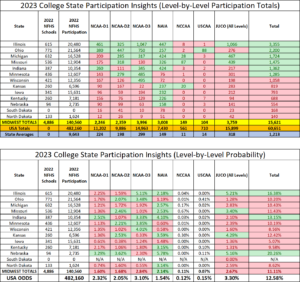
The Midwest has the most states and the largest number of high school baseball participants of our 7 regions. The 13 states account for just over 29% of all high school baseball players nation-wide but only 25.8% of college baseball participants. The probability of Midwest players moving on to play college baseball at any level (11.11%) is below the national average (12.58%). In fact, Midwest’s overall probability ranks 6th out of the 7 regions, ahead of only the Southwest (9.54%). For each level of college baseball except NAIA, the probability for playing among Midwest players is below average. Most notably, the probability of playing D1 for the Midwest region is the lowest of any other region we put together at 1.60%.
You can see the complete breakdown of the Midwest below, where boxes in green are above the national averages and boxes highlighted in red are below the national averages. Due to small overall participation numbers, we did not color code the probability boxes for NCCAA and USCAA levels.
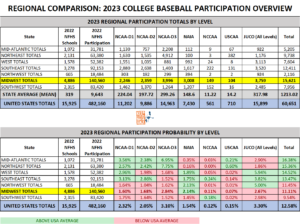
Regional Comparison
Below, you can see how the Midwest matches up against other regions.
Below we provide an advanced breakdown of each state (listed in alphabetical order). To read the complete article on each state, simply click on the state name!
Illinois
With high school participation that ranks in the top 5 nationally, it’s no surprise that Illinois residents are well represented in college baseball at every level. The probability of playing college at any level for Illinois residents (16.38%) is well above the national average of 12.58%. That number is buoyed by well above average representation in both NCAA-D3 and JUCO baseball and above average NAIA representation. NCAA-D1 and D2 marks fall slightly below average. A glance at state insights for Illinois on College Baseball Insights shows that the overwhelming majority of residents who play at the next level are doing so in-state or in neighboring states. The numbers by level all make sense for the Prairie State, given the density of NCAA-D3 (21 programs, tied with Wisconsin for 4th most in country) and JUCO (38 programs, the most of any state outside of California) programs in Illinois and the surrounding states.
Indiana
Overall, the college baseball outlook for Indiana high school graduates across all levels (13.15%) is better than the Midwest average (11.11%) and national average (12.58%). Indiana is above national probability of playing at the D1, D3, and NAIA levels. Indiana’s 4.1% rate of sending graduates to junior college programs ranks 3rd out of all 50 states and well above the Midwest average (2.14%) and national averages (1.54%). Where Indiana falls short of national marks appears to be due in part to having very few in-state options. There are two NCAA D2 programs and 2 junior college options in the Hoosier state. 843 of the state’s 1,362 college baseball players stay in-state.
Iowa
The probability of playing college baseball for Iowa high school ballplayers is bleak to say the least. Iowa joins Texas as the only states with no level above the national average and in Iowa’s case, it has no level represented above the Midwest averages. With an overall probability of playing in college of 5.07%, it’s less than half the national average (12.58%) and the lowest of any state in the country. Iowa is home to 11 junior college programs, but only sends 1.36% of players to the JUCO level. Iowa’s 10 D3’s gives it the 11th most of any state yet it’s 1.24% D3 participation is well below national and Midwest totals. NAIA is a similar picture. 11 programs is a lot compared to the high school participation numbers, yet only 1.48% of Iowans play at the NAIA level. Iowa’s D1 probability (.61%) and D2 odds (.38%) are hampered by only 1 in-state option for each and amount to the second lowest probabilities of any state at each respective level. Iowans who want to paly at D1 or D2 programs will have to work hard to look at and make connections with out-of-state options.
Kansas
Overall, the probability of playing in college at any level for Kansas high school players (12.42%) is just below the national average (12.58%). In Kansas, junior college baseball (4.29%) is king with NAIA (3.59%) close behind. Both levels are well above the national and Midwest averages for the respective levels. With the 2nd most NAIA programs of any state in the county (13) and an abundance of junior college programs (19), players deciding to stay in-state have a lot of options at those levels. D2 baseball is also well represented by Kansas grads, sending 2.53% to that level compared to 2.05% national probability. On the flip side, Kansas has very low D1 (1.36%) and D3 (.33%) representation. With no in-state D3 programs and other college levels with many programs, it makes sense that Kansas has the lowest D3 representation of any Midwest state.
Kentucky
Overall, the probability of playing college baseball at any level for graduates of the Bluegrass state (9.58%) is well below national (12.58%) and Midwest (11.11%) averages. All levels of college baseball are under-represented by Kentucky graduates with the exception of NAIA, which has a 3.15% participation rate north of the national average (1.54%) and Midwest average (2.14%). Kentucky’s under-representation in college baseball is not surprising given the state has no junior college programs and only 26 total college baseball programs within its borders. For this reason, the neighboring states have nearly half the total number of participants as those deciding to play in-state, which is on the high end, especially for the Midwest. The state’s three Division 2 programs help explain why the D2 participation rate is the lowest of nay college level at 1.06%.
Michigan
Michigan has the 3rd most high school participants in the Midwest region and top 10 participation nationally. Overall, the college baseball outlook for Michigan high school graduates is below average. It’s 10.43% probability of playing college baseball at any level is lower than the national average of 12.58%. Like the Midwest region itself, the only level of college baseball where Michigan graduates have a higher probability of playing than the national average is the NAIA level. With 10 NAIA programs in-state, this isn’t altogether surprising. What is a bit more surprising is that Michigan ballplayers have only a 1.21% probability of playing at the D1 level, far below the national average of 2.3 and even well below the Midwest region’s 1.6%. Even with top 10 national high school participation totals, only 200 Michigan high school grads are at the D1 level right now. That total is well below neighboring Indiana (260) to the south, despite having 6,000+ more high school baseball participants than the Hoosier state. Only 6 in-state D1 programs may contribute to that issue since 1323 of Michigan’s 1724 college players stay in-state.
Minnesota
Overall, the college baseball outlook for Minnesota high school graduates across all levels (10.19%) is below the Midwest average (11.11%) and the national average (12.58%). The two levels of college ball where the probability of playing is better than national averages is at the D2 (2.21%) and D3 (3.85%) ranks. With 8 D2 and 17 D3 programs in Minnesota, these numbers make sense. With no NAIA programs and only recently getting the 2nd in-state D1 program, it’s no wonder that the probability of playing at these levels (.6% and 1.13%, respectively) is so far below Midwest and national averages. Almost all Minnesota players who continue on in college play in-state or a bordering state.
Missouri
Overall, the college baseball outlook for Missouri high school graduates across all college levels (11.43%) is better than the Midwest region average (11.11%), but worse than the national average (12.58%). Missouri is above the national average at sending players to the D2 and NAIA levels thanks to numerous in-state options at each level (12 and 13, respectively). It is also above average at sending players to the junior college ranks. This is a product of having 11 programs in-state and 19 in neighboring Kansas. 66 current JUCO players from Missouri are playing in Kansas’ Jayhawk Community College Conference. Also helping to buoy Missouri’s overall numbers is the 87 players it sends to play in the NCCAA level. That is third behind only Texas and Florida.
Nebraska
When you think of Nebraska, you likely don’t think of a college baseball pipeline, but the home to the D1 College World Series is exactly that. Overall, the probability of playing college baseball at any level for graduates from Nebraska (20.26%) is the second highest of any state in the country trailing only Hawaii (21.48%). Across all levels of college baseball, Nebraskans are well-represented. In fact, every level of college baseball has representation above both national and Midwest averages, except D3 whose probability of 2.3% trails national (3.1%) and Midwest (2.84%) averages just slightly. NAIA and junior college baseball account for over half of Nebraska’s overall college baseball participation, sending 5.78% and 5.16% of its players to each respective level. The state’s 7 NAIA programs and 4 JUCO programs are substantial for having only 2,735 total high school participants, the 2nd fewest of any Midwest state. Surprisingly, despite only 1 in-state D2 program, Nebraska’s D2 participation is also strong at 3.62% participation. Nebraska’s out-of-state participation is a big reason for it’s success in moving players to the college level. There are nearly as many out-of-state college baseball players in bordering states as there are in-state, which is rare. There is also participation in nearly every state with the exception of the Northeast.
North Dakota
Overall, the probability of playing in college at any level for North Dakota high school players (8.62%) is well below the national (12.58%) and Midwest (11.11%) averages. North Dakota only has one level, NAIA, where participation probability is above the national average at 3.14. Given that a third of all college programs in North Dakota are NAIA, this makes sense. There are no D3 programs and only one D1 and the corresponding D3 (.55%) and D1(.74%) probabilities represent some of the lowest totals among all states. With 4 junior college programs in-state, North Dakota’s JUCO participation of 2.59% only slightly trails the Midwest average (2.67%). One in five of North Dakota’s 140 college baseball participants play in neighboring Minnesota.
Ohio
It may surprise you to find out that Ohio has the 3rd most high school baseball players of any state in the country. As such, it’s no surprise that they are well represented at most levels, with the exception of JUCO, where they fall significantly below the national average of total participants in spite of great participation numbers. While well represented in total participants, the probability of playing baseball in college for Buckeye State ballplayers (10.2%) is well below the national average of 12.58%. Only NCAA-D2 and D3 representation from Ohio is above the average marks and just barely. The D3 numbers should set off some alarm bells because Ohio’s 22 D3 Baseball Programs is the 3rd most of any state nation-wide. With only 5 NJCAA programs in Ohio, the low JUCO participation makes sense, especially given roughly 3/4 of Ohio high school graduates playing in college play in Ohio. Beyond Ohio and its neighboring states, there are very few Ohio graduates playing out-of-state.
South Dakota
South Dakota has it’s own high school baseball association, so high school player participation data from NFHS is not available. When we look at the overall number of South Dakota grads playing college baseball at each level, it’s no surprise that the raw totals are below average based on population (5th lowest population total of all states) and weather (cold!). South Dakota has the most participation in NAIA, where it sends 78 players and the least participation at the D3 level where it has 10 players. The state houses on D1, three D2, and 3 NAIA programs.
Wisconsin
Overall, the college baseball outlook for Wisconsin high school graduates across all levels of college baseball (8.56%) is well below the Midwest (11.11%) and national (12.58%) probabilities for playing at the next level. In spite of the low overall probability, the probability of playing at the D3 level (4.01%) is 2nd in the Midwest region. At the D1 level (1.35%), D2 level (1.02%), NAIA (.58%), and junior college level (1.6%), the probability of playing is well below the Midwest and national averages. All these totals make sense since Wisconsin only has one D1, D2, and NAIA school. There are 22 D3 programs and 4 junior college programs in Wisconsin.
Limitations
This article was written with data and insights from 3rd party sources, College Baseball Insights and NFHS High School Participation Data. Data and insights are subject to revision and/or change. We’ve attempted to display as accurate a picture as possible with the information that is available. Readers should be aware that college baseball roster data is fluid and changes throughout the year. Every attempt is made to reconcile data and keep up with changes, but this article may not reflect the changes or updates from 3rd parties. Insights cannot account for gap year programs, misreported roster information, or other inaccuracies which may slightly alter the numbers and percentages used in this article. Insights are subject to change and are based on best available information.